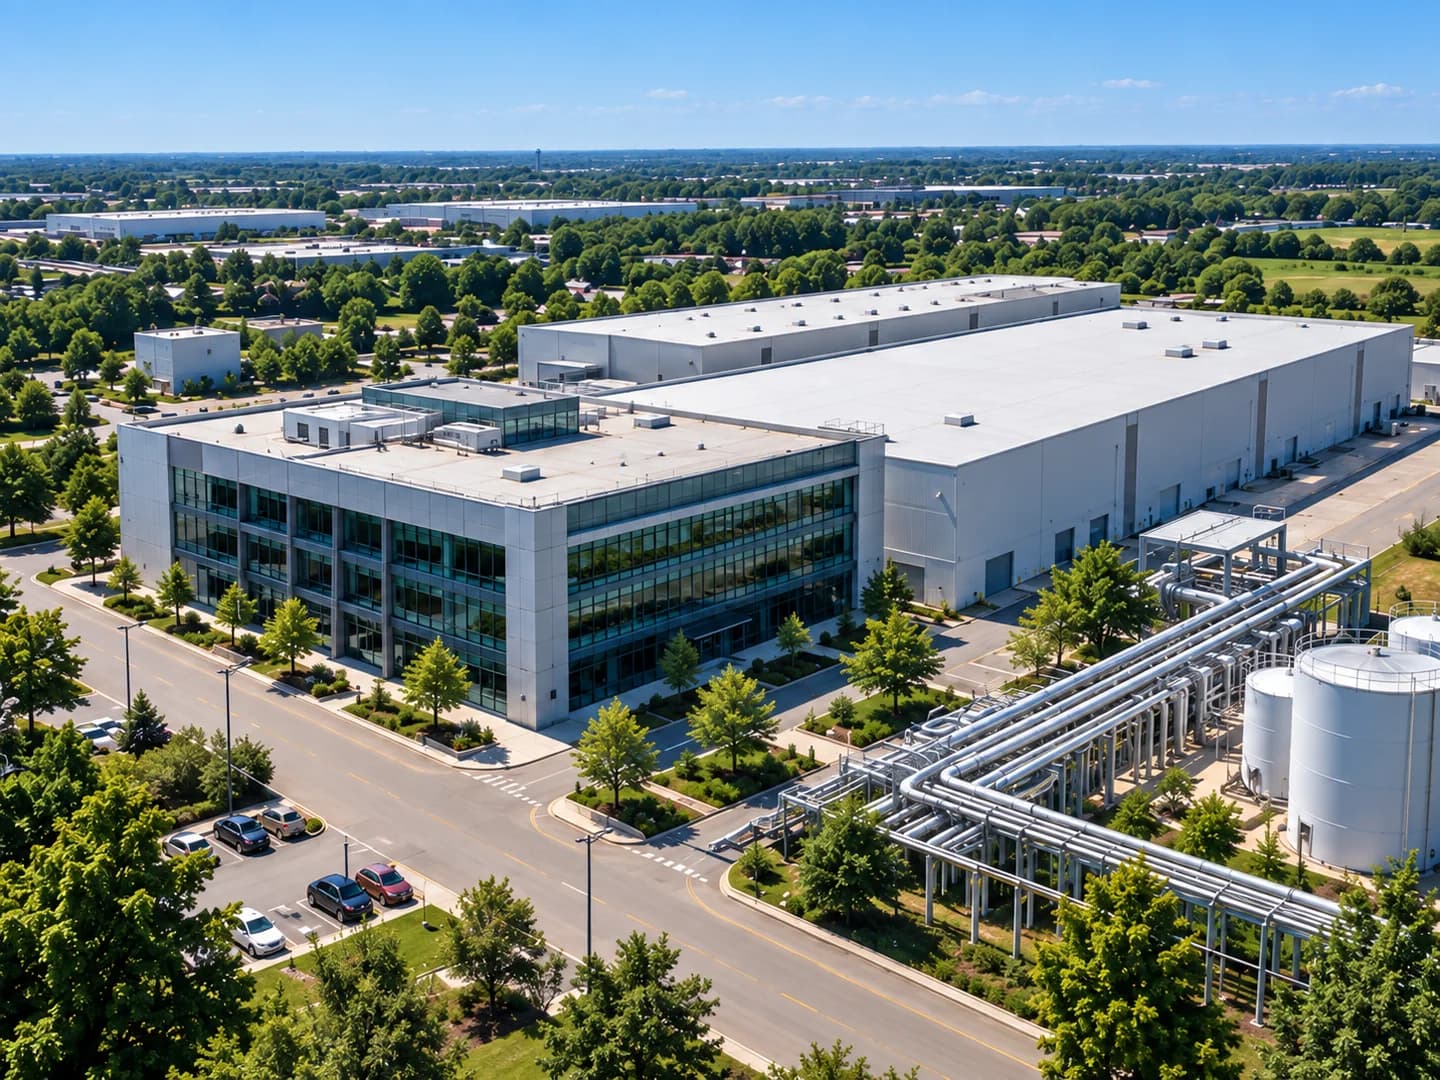
Manufacturing.
In clear view.
Connect utility use to the work on your factory floor. Explore how monitoring helps your team compare processes, investigate losses and track resource intensity.
Find the issue. Know the next step.
Put consumption beside production.
Start with metered production areas and their shift schedules. Compare readings across processes before investigating a change. The production areas and values here are illustrative.
Fictional locations shown to explain the workflow.
The shift ends. The flow continues.
A production area still draws water after its scheduled shift. Compare the reading with cleaning cycles and other planned activity to decide whether the pattern needs investigation.
View sample readings as a table
| Hour | Sample (L/min) | Expected (L/min) |
|---|---|---|
| 00:00 | 18 | 4 |
| 01:00 | 15 | 4 |
| 02:00 | 13 | 4 |
| 03:00 | 11 | 4 |
| 04:00 | 10 | 4 |
| 05:00 | 8 | 4 |
| 06:00 | 4 | 4 |
| 07:00 | 6 | 6 |
| 08:00 | 17 | 17 |
| 09:00 | 27 | 27 |
| 10:00 | 35 | 35 |
| 11:00 | 40 | 40 |
| 12:00 | 38 | 38 |
| 13:00 | 36 | 36 |
| 14:00 | 34 | 34 |
| 15:00 | 31 | 31 |
| 16:00 | 24 | 24 |
| 17:00 | 18 | 18 |
| 18:00 | 12 | 12 |
| 19:00 | 8 | 8 |
| 20:00 | 6 | 6 |
| 21:00 | 4 | 4 |
| 22:00 | 4 | 4 |
| 23:00 | 4 | 4 |
Follow the resource through the process.
Where suitable sub-metering exists, compare process inputs and outputs. Confirm the meter coverage and timing before interpreting a difference as loss. Review valves, cleaning activity and production records with the team.
View sample readings as a table
| Hour | Sample (L/min) | Expected (L/min) |
|---|---|---|
| 00:00 | 18 | 4 |
| 01:00 | 15 | 4 |
| 02:00 | 13 | 4 |
| 03:00 | 11 | 4 |
| 04:00 | 10 | 4 |
| 05:00 | 8 | 4 |
| 06:00 | 4 | 4 |
| 07:00 | 6 | 6 |
| 08:00 | 17 | 17 |
| 09:00 | 27 | 27 |
| 10:00 | 35 | 35 |
| 11:00 | 40 | 40 |
| 12:00 | 38 | 38 |
| 13:00 | 36 | 36 |
| 14:00 | 34 | 34 |
| 15:00 | 31 | 31 |
| 16:00 | 24 | 24 |
| 17:00 | 18 | 18 |
| 18:00 | 12 | 12 |
| 19:00 | 8 | 8 |
| 20:00 | 6 | 6 |
| 21:00 | 4 | 4 |
| 22:00 | 4 | 4 |
| 23:00 | 4 | 4 |
Measure use per unit of output.
Compare follow-up readings with production output as well as total consumption. A quieter production period can reduce use without improving efficiency. Resource intensity provides a more useful comparison when reliable output data is available.
View sample readings as a table
| Hour | Sample (L/min) | Expected (L/min) |
|---|---|---|
| 00:00 | 4 | 4 |
| 01:00 | 4 | 4 |
| 02:00 | 4 | 4 |
| 03:00 | 4 | 4 |
| 04:00 | 4 | 4 |
| 05:00 | 4 | 4 |
| 06:00 | 4 | 4 |
| 07:00 | 6 | 6 |
| 08:00 | 17 | 17 |
| 09:00 | 27 | 27 |
| 10:00 | 35 | 35 |
| 11:00 | 40 | 40 |
| 12:00 | 38 | 38 |
| 13:00 | 36 | 36 |
| 14:00 | 34 | 34 |
| 15:00 | 31 | 31 |
| 16:00 | 24 | 24 |
| 17:00 | 18 | 18 |
| 18:00 | 12 | 12 |
| 19:00 | 8 | 8 |
| 20:00 | 6 | 6 |
| 21:00 | 4 | 4 |
| 22:00 | 4 | 4 |
| 23:00 | 4 | 4 |
From monitoring to action
Connect your meters. Understand the pattern. Give your team a clear starting point for investigation.
Water, energy and gas in production context
Manufacturing sites need to understand both resource consumption and what that consumption produces. Smart-View supports utility visibility across metered areas, with scope determined by the processes and data sources available. Monitoring helps teams explore input-output flow, identify unusual patterns and ask more precise questions about where resources go.
Explore industrial gas monitoringIn practice / PepsiCo
Connected water and gas. Clearer decisions.
How PepsiCo’s Atlantis Cereals plant used utility monitoring to support water stewardship and operational decisions.
Read the customer storyMonthly sewage-cost reduction reported in the published case study.
Results relate to this customer story.
Now, let’s look
at your sites.
Book a manufacturing demo. We’ll discuss your meters, priorities and the next step for your operation.
Build useful measures around your process
Water per process cycle and energy per unit produced can complement total consumption. Valid comparisons need consistent units, matched reporting periods and reliable production data. Start your demo with the process you want to understand, your meter layout and an example of an output report. We will discuss where additional measurement is needed before drawing conclusions about efficiency.
info@smartviewtechnology.co.za